Prototyping a Game Master Digital Assistant
Researching how we can design computational tools to help support game masters running tabletop roleplaying games.
Over the last year, I have been interviewing game masters (GMs) of tabletop roleplaying games (TTRPGs) about their process preparing for and running their games, with a focus on how they facilitate collaborative storytelling. I’m interested in better understanding the GMing process in order to help inform the creation of computational tools to help support GMs running TTRPGs. Here I discuss the creation process for a prototype of a computational support tool for GMs, informed by this interview process.
Findings from the interviews conducted showed two major areas in which GMs could be further supported. The first area is in information visualization. GMs tended to have a lot of information to parse and remember, whether they were running a game based on a detailed game module or creating their own world for the game. Finding this information reliably during play and keeping track of this information (such as who players have met or where they have been) is difficult and has to be done quickly and reliably because of the improvisational and real-time nature of play. I also found that new GMs found the improvisational part of GMing difficult, and having a computational system that could provide suggestions and creativity support for new GMs would be helpful to remove some of the barrier to entry for new GMs and scaffold the GMing process. While the prototype I’ve created so far only covers the information visualization part of supporting GMs, it also lays the groundwork necessary for creating a creativity support assistant for GMs, which I will discuss in more detail below.
Play progression graphs for Lost Mine of Phandelver
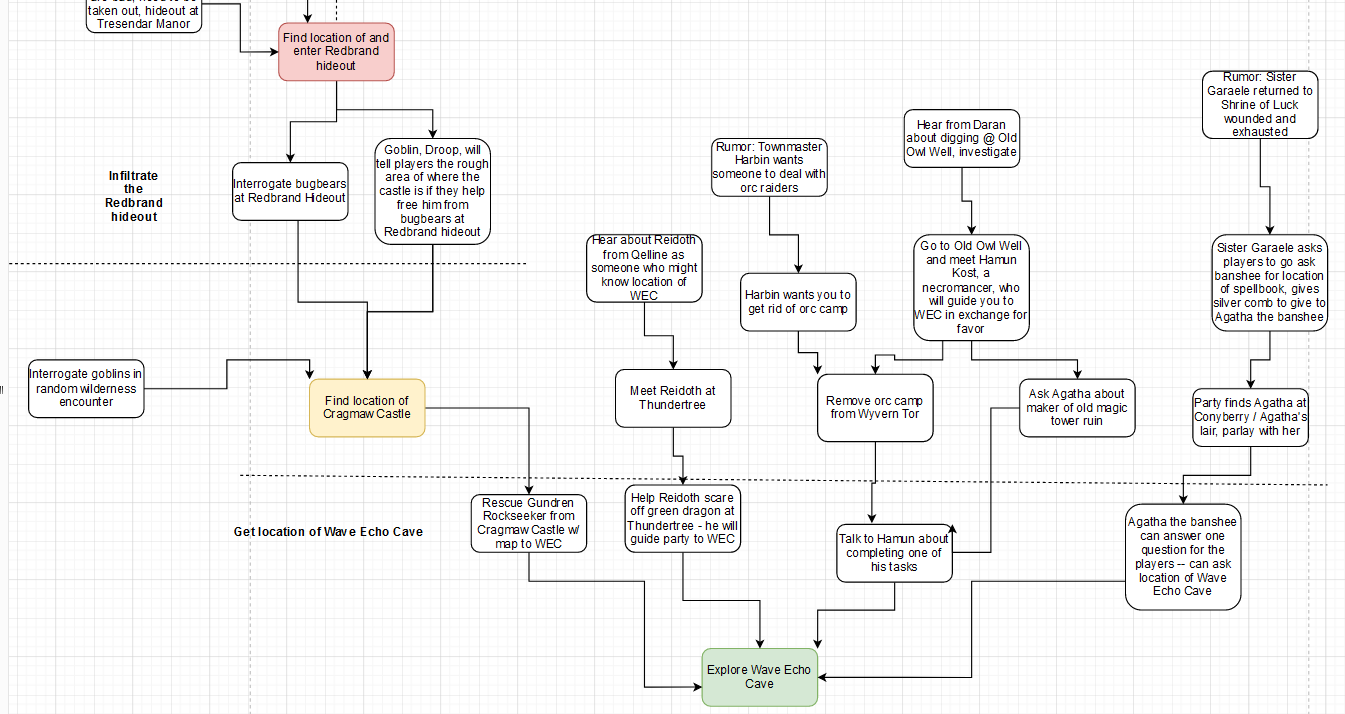
To begin this project, I wanted to see how I might map out the possibility space of a TTRPG module. I chose the introductory Dungeons & Dragons 5th edition module Lost Mine of Phandelver because it uses a popular TTRPG system and is relatively short and simple. I created a graph of the different paths through the story space, routes that players can take to progress and get the information they need to find the titular lost mine of Phandelver. These graphs focus on Chapters 2 and 3 of the module because these chapters offer the player more choices of paths to pursue, structured as a hub with various quest hooks that allow the players to go off in different directions. The first graph I created was by hand using a graph editor, and can be seen here:
From here, I wanted to create a version of this graph that could be altered programmatically, as this could allow one to adjust connections and information as needed without creating many new graphs by hand. This would allow GMs to be able to make quick changes to the state of the game without having to make and edit new graphs every time. I used the Javascript-based diagramming tool Mermaid, which generates a graph based on a Markdown-like syntax that can be displayed in a webpage.
In order to auto-generate these graphs, I first created JSON files containing the information from the module and encoding the connections between them. Each JSON object represents either a character, location, or a piece of information, and has a “tag” that other objects can use to reference it. The object also contains information on the connections between nodes--for example, each location contains an array of characters in that location, each character contains an array of the information they know, and information can lead to new locations or other information. We can represent a character, Pip, who knows the secret location of a tunnel to the base of the Redbrands, a local gang, as:
               {
                 "tag": "Pip",
                 "fields": {
                  "name": "Pip",
                  "status": "alive",
                  "information": ["SecretTunnelKnowledge"],
                  "friendOf": "Carp"
                  }
                }
The information that Pip knows about (referenced in the “information” section of the JSON object) is represented as:
                {
                  "tag": "SecretTunnelKnowledge",
                  "fields": {
                    "text": "Carp at Alderleaf Farm saw a secret tunnel in the woods;
                      the Redbrands almost caught him",
                    "known": "false",
                    "locations": ["AlderleafFarm"],
                    "goesTo": ["SecretTunnelLocation"],
                    "storyline": "RedbrandStory"
                  }
              }
I used JSON to represent the game state because it is human-readable and easy to edit quickly.
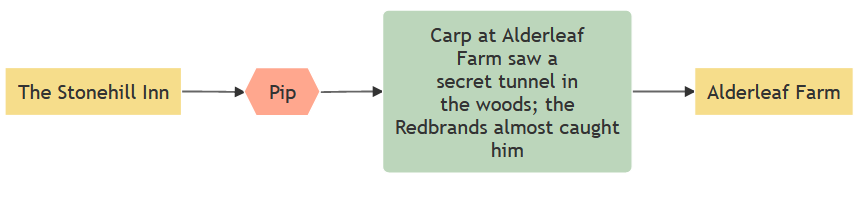
In order to get the JSON objects into a state that can be displayed by Mermaid, I iterate through each of the JSON objects, generate the appropriate Markdown-like syntax for each node and their connections, and add these to the HTML file displaying the graph. Each entity's data (location, character, information) is also stored in a DataScript database that can be used to query for the relevant information when adding text to the visualization. For instance, it can be used to get a list of all the character names, or to get a character’s occupation given their name. An example of the Markdown-like syntax generated by this process can be seen below. This displays the connection between Pip’s location (the Stonehill Inn) and Pip, the connection between Pip and the information he knows, and the connection between that information and the location that it leads to:
              StonehillInn[The Stonehill Inn]:::locclass-->Pip{{Pip}}:::charclass
              Pip-->SecretTunnelKnowledge("Carp at Alderleaf Farm saw a secret tunnel in the
              woods; the Redbrands almost caught him"):::infoclass
              SecretTunnelKnowledge-->AlderleafFarm[Alderleaf Farm]:::locclass
The terms “locclass,” “charclass,” and “infoclass,” are used to differentiate the nodes as different kinds of entities (location, character, character knowledge), which is used to color the graph and make each type more visually distinct. The visualization for the above code can be seen here:
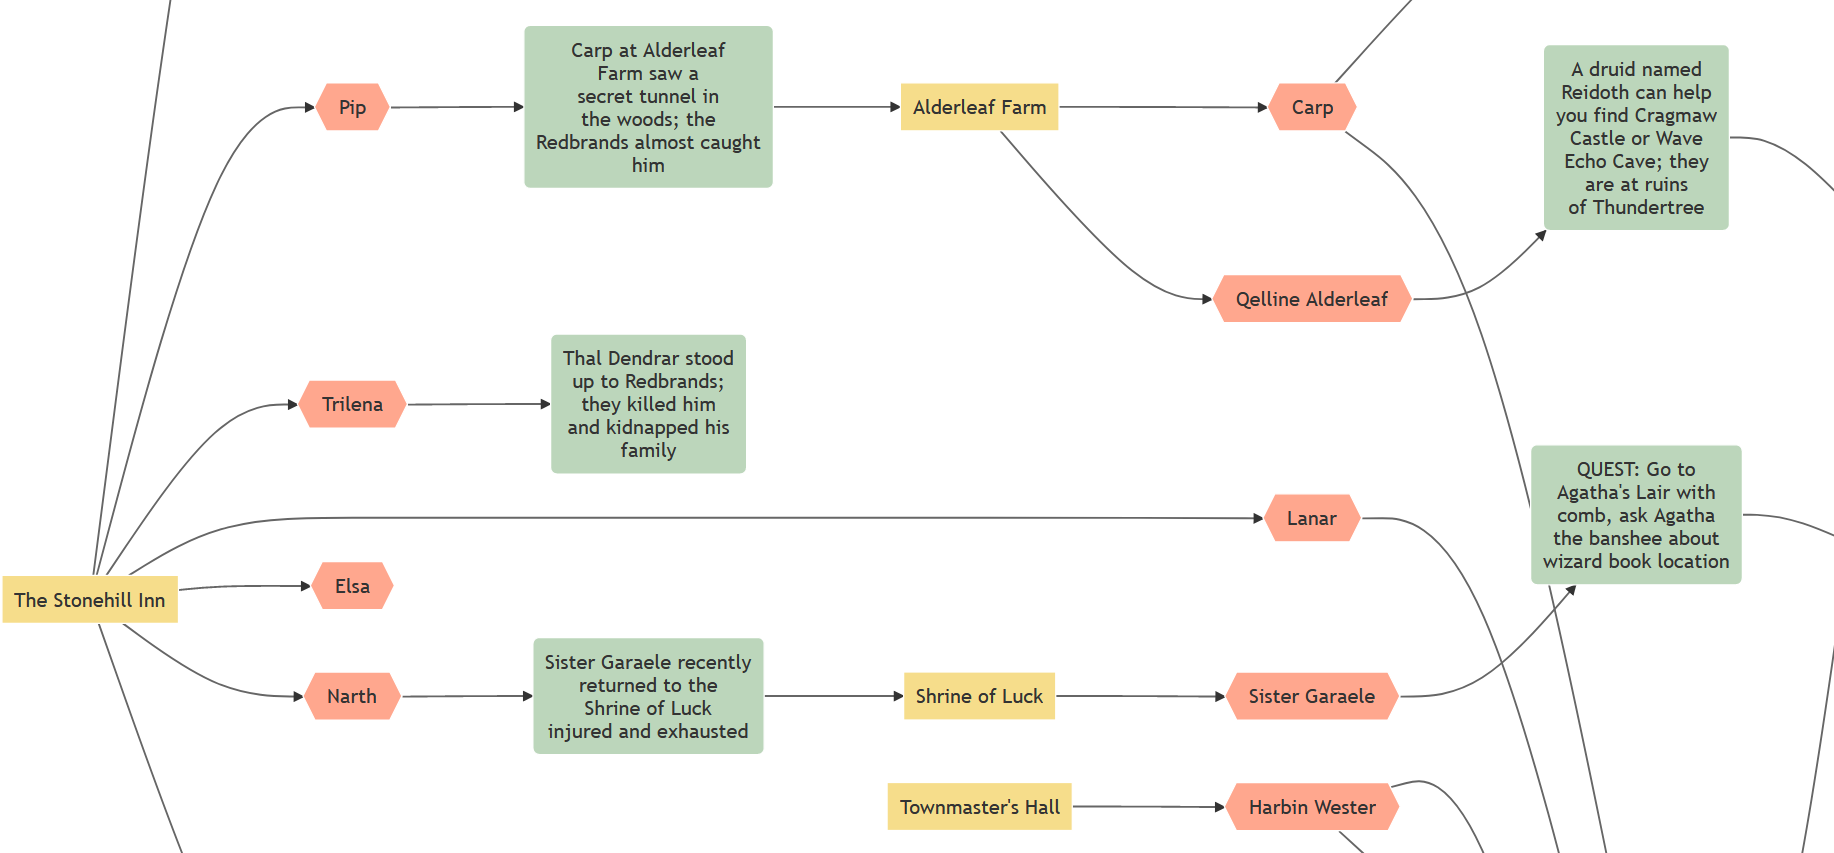
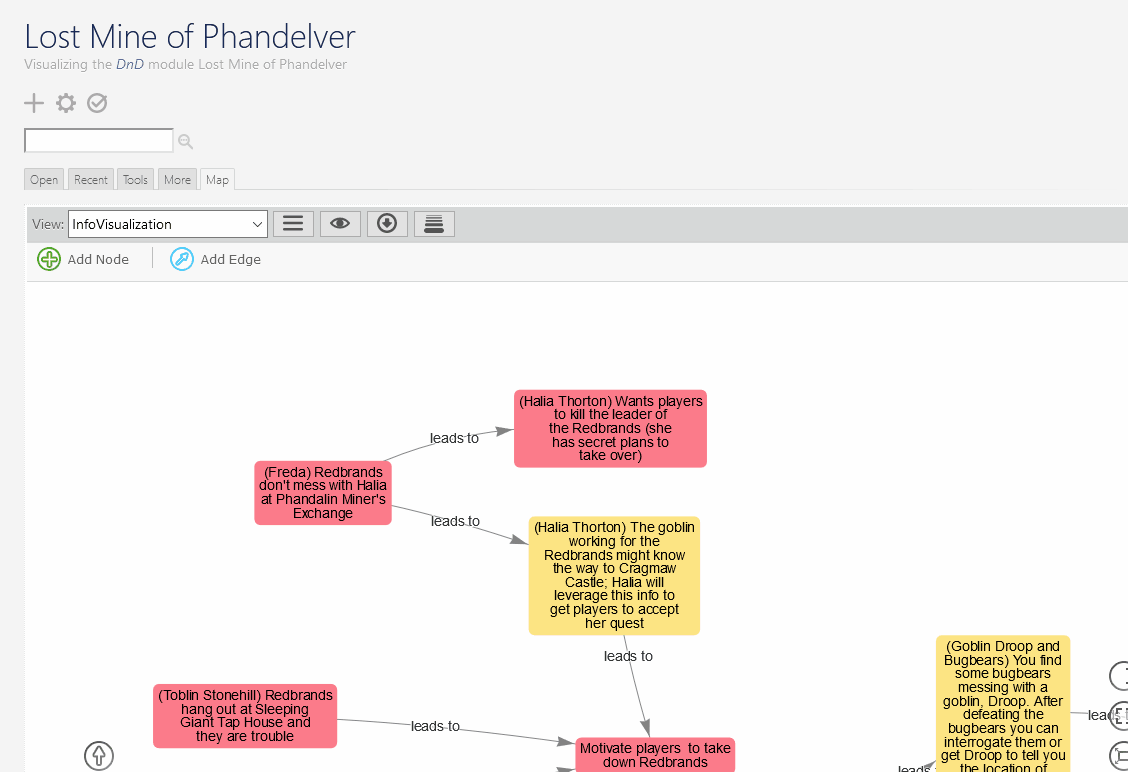
I created several visualizations of the information from Lost Mine using Mermaid. In the expanded version, all locations, characters, and character knowledge are depicted as separate nodes connected to one another. Each node type (location, character, or character knowledge) has a distinct color and shape to make it easy to distinguish from the other kinds of nodes. Connections are based on how these elements are connected in the story--locations have characters, characters have character knowledge, and character knowledge can lead to new locations or new knowledge. You can see the expanded version here:
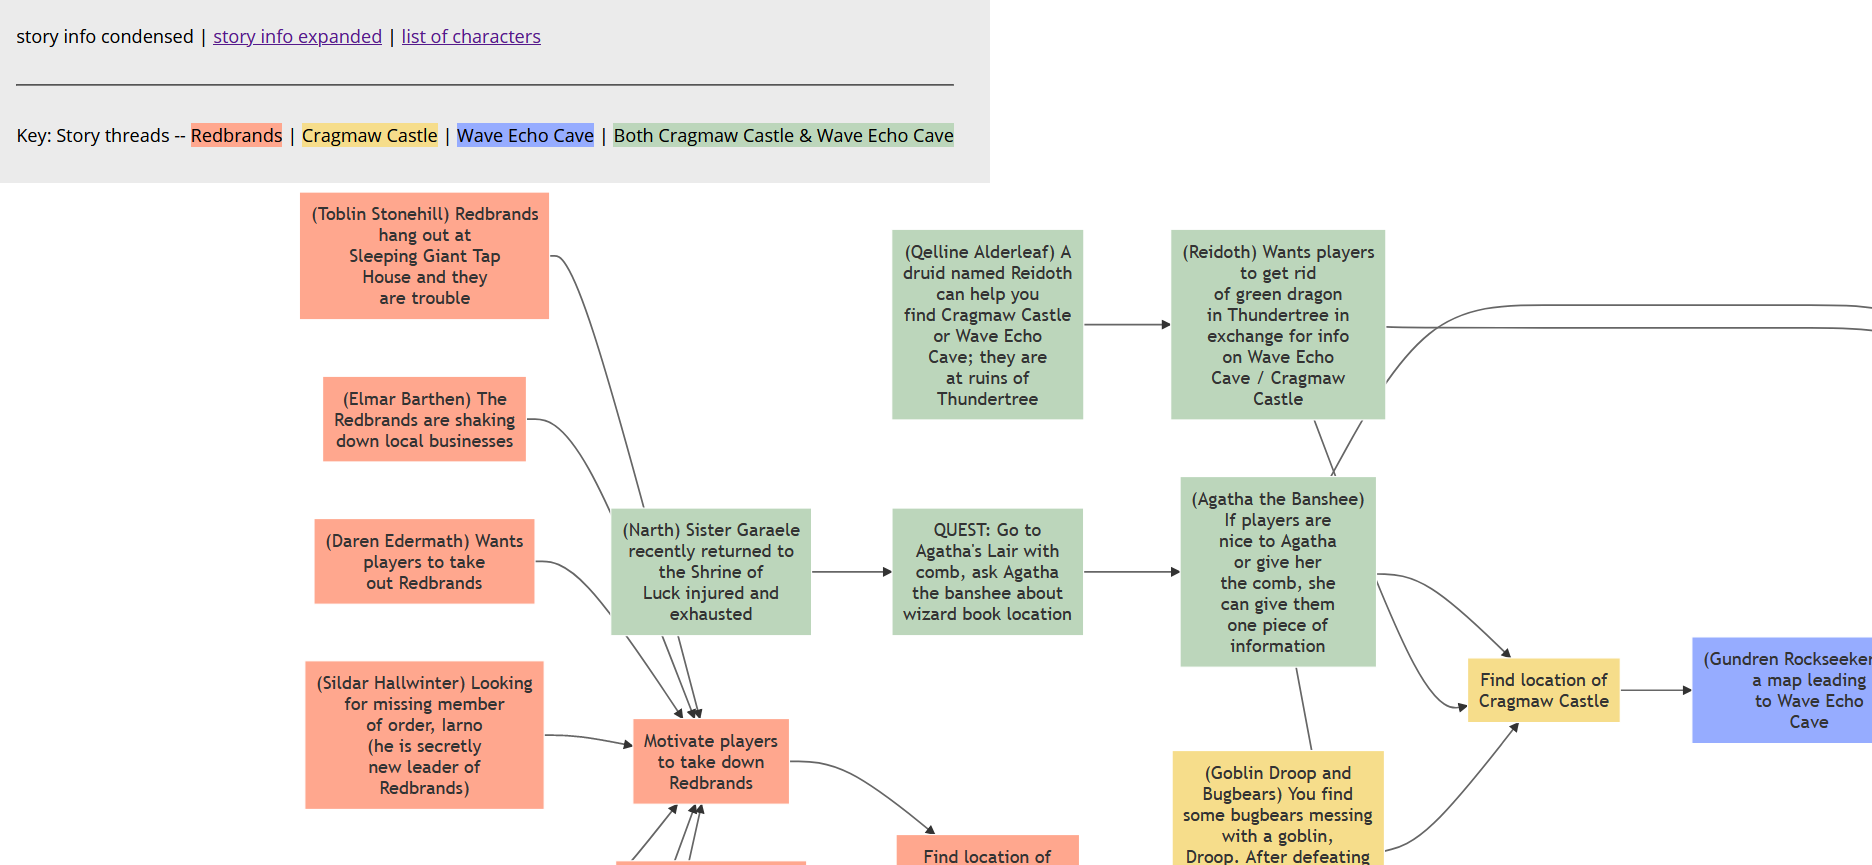
In the condensed version, characters and character knowledge are represented in nodes that display the character and the knowledge that they have together in one node. Nodes are colored according to which story threads they progress--contributing to helping the players defeat the Redbrands (red), reach Cragmaw Castle (yellow), or find Wave Echo Cave (blue). In some cases, character knowledge can help players either find Cragmaw Castle or find Wave Echo Cave depending on how the players advance. These are colored green (as the combination of the yellow and blue story threads). You can see the condensed version here:
I also wanted to create a visualization of this information that could be easily altered by the end user so that quick adjustments could be done on the fly, as might be needed in creating visuals for hypothetical scenarios both before and during interviews. I used TiddlyWiki, an automatic graph generator, to create an interactive version of the graph using the same JSON files to auto-generate Wiki pages with the appropriate text information and to generate a graph with connections between nodes based on these pages. This visualization allows the end user to edit existing nodes and connections and add in their own nodes and edges as needed. This could be used, for example, for changing the content of the module depending on what the GM wants to run, and making changes to the graph depending on what happens during play.
The static visualizations are available here: https://www.devi-a.com/DnDFlowchart/index.html
The interactive visualization is available here: https://www.devi-a.com/DnDTiddlyMap/
A prolog database for Lost Mine of Phandelver
While these initial graphs were helpful in showing how digital technology could start to help visualize a TTRPG module, I knew that this was just the start. After conducting another round of interviews with GMs about these graphs, I got insights into more ways that digital tools might be helpful to GMs, including advice about making a queryable database that GMs can use to quickly find important information such as lists of characters in certain locations or lists of quests that a character has to offer. To that end, I decided to create a web interface for accessing and editing a database that contains information about the characters, locations, and other elements of the game world taken from the JSON files that I had already created. I decided to use the logic programming language Prolog as the backend language for my database because it would allow me to do complex queries on information about the world that would be particularly helpful if offering up creative suggestions to the GM for what could happen next. I talk more about this in the next section.
Prolog and complex queries
To begin, I wrote a python parser to convert all of my JSON structures into Prolog representation for the module information. All of the entities in the world are represented with an array of the details associated with them so that I can easily query the database for all information about a given entity (ex. character) by querying for the character and each element in that array. As an example, let’s take the character Pip, from before. To begin, we have an array that represents the details about the character:
character_info_list(pip, [first_name, status, friend_of, knows_info]).
From this, we know that Pip has a first name, status, he is a friend of another character, and he knows some information. These are represented in Prolog as:
                character(pip).
                first_name(pip, pip).
                status(pip, alive).
                friend_of(pip, carp).
                knows_info(pip, secret_tunnel_knowledge).
The first element of each of these is the character’s tag (usually represented as firstname_lastname, or just firstname if the character does not have a last name). This tag is used as a reference by other entities; for instance, to say that Pip is at Stonehill Inn, I use the representation char_in_location(stonehill_inn, pip). I can then use Prolog queries to get all of the information about a given character, location, etc. by just iterating through the array of details and then display the information using JavaScript (JS) / HTML as a frontend. For example, I query for a list of all the characters using:
                  session.query("character(Char), character_info_list(Char, Char_Info_List).");
                  session.answers(get_callback(get_all_bindings));
This will get me all of the instances of bindings where there is a character Char that has a list of information (the array used to hold the character details). In this case, Char is a variable that is the same for character(Char) and character_info_list(Char, Char_Info_List) and Prolog looks for and binds to this variable all instances where it finds this pattern in the database. This produces a list that I can save to a JS variable, and iterate through to get the individual values of all of a character’s details. For instance, given a list of character tags and a list of character detail arrays given from the earlier code, I can use:
                session.query("Pred = " + character_info_list[i] + ", findall([Pred, Info], call( Pred, " +
                character_tag + ", Info), List).");
This gets me each individual detail about a character (such as secret_tunnel_knowledge from the statement knows_info(pip, secret_tunnel_knowledge).) so I can add each entry to a table to display to the user. I talk more about this in the next section.
Prolog can also be used for more complex queries that can let the user find out specific information about the world state. Using Prolog queries and searching through the database for valid bindings for those queries allows the user to specify patterns that might be difficult to find otherwise. This can be used to find interesting story content like relationships and dynamics between characters, for instance serving up a list of characters who are friendly with each other but are from factions that oppose one another to get a Romeo and Juliet-type dynamic. This can also be used to set up interesting events in the world based on the consequences of player actions. For example, if the players leave the town of Phandalin but have not dealt with the Redbrand leader, the GM might have the Redbrands expand their power by taking over the town. These are either queries that could potentially be searched for by a GM in a future iteration of this project, or used by a computational system for providing suggestions to GMs by checking for pre-conditions on suggestions for what can happen next in the game world based on what has already happened.
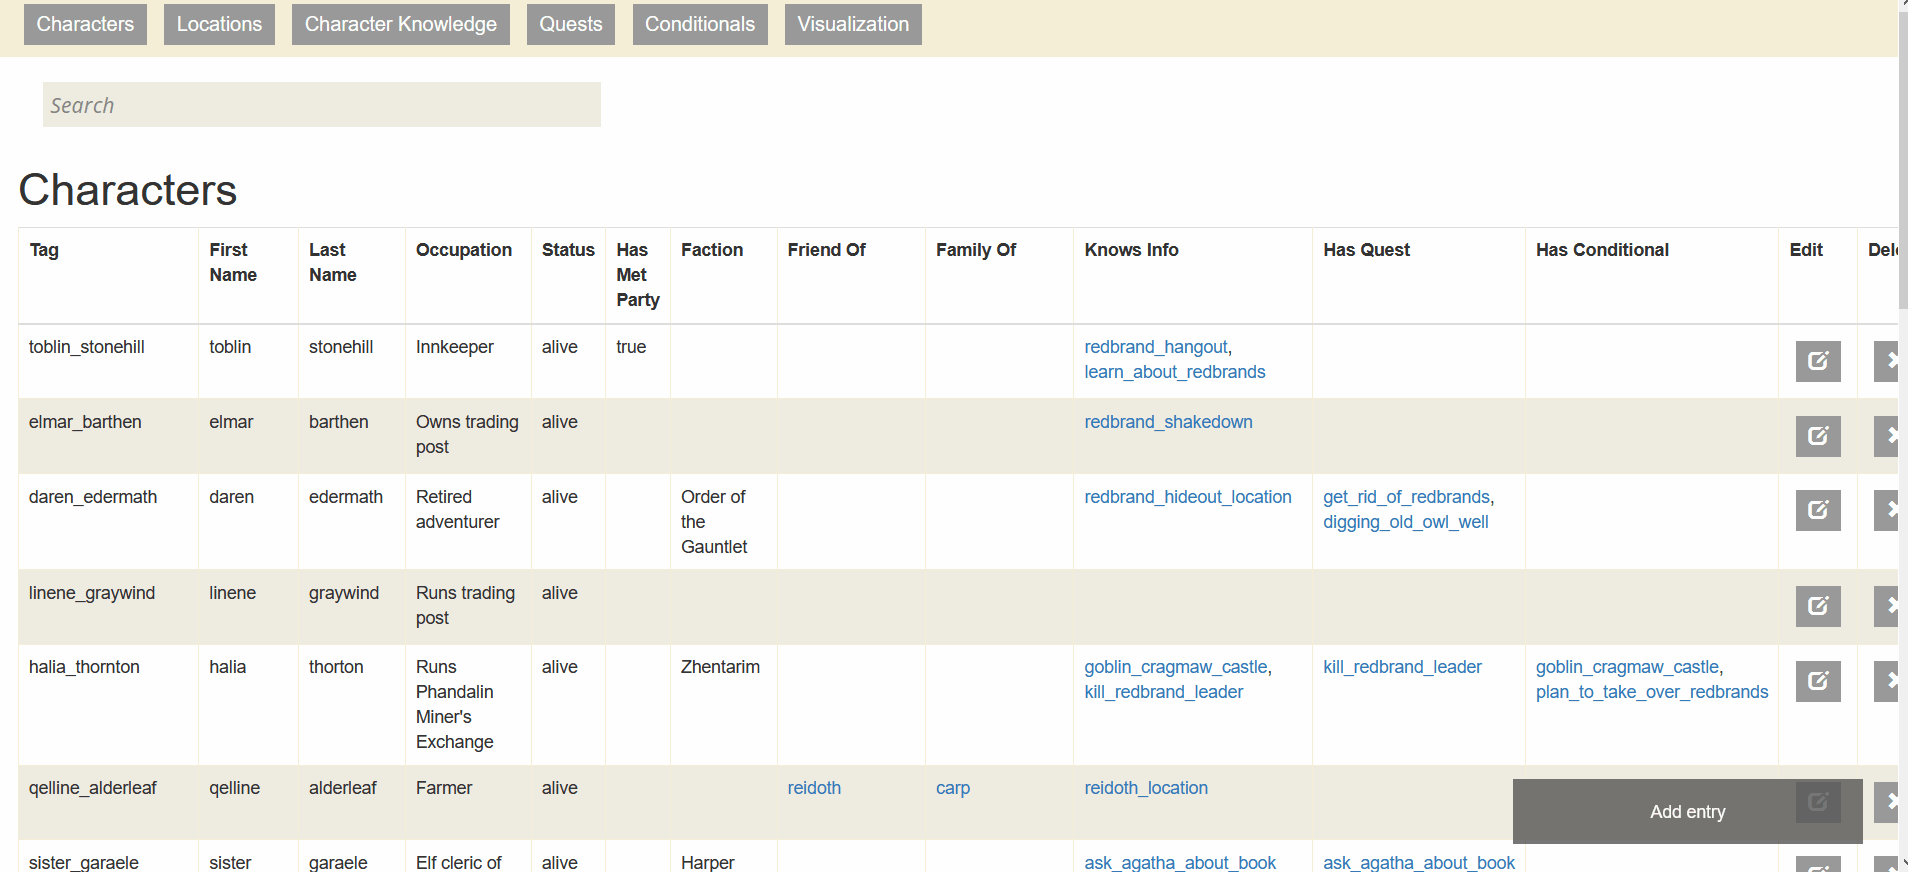
Creating an interactive database
By querying a Prolog database as described in the previous section, I created a web interface for displaying information from the module Lost Mine of Phandelver, displaying the information in a table like so:

At first, I represented all entities in the module as either a kind of “character,” “location,” or “piece of information.” After further looking at examples of information in the module, the “information” type was broken up into “character knowledge,” “quests,” and “conditionals.” Character knowledge represents information that characters have and can pass on to players, quests represent requests that NPCs have (and possibly give rewards to players for completing), and conditionals represent a kind of NPC AI, or ways that characters will act under certain circumstances.
The next step in my process was making this database interactive. GMs should be able to search through different entries, as well as add, edit, and remove them from the database as needed. Implementing search is relatively simple--typing in the search bar updates a variable filterString with the value of the search, and the function displaying rows in the table first looks through all the values in the table row to see if there is a match with the value of filterString. If there is not, the function does not display that table entry. For adding entries, I created a form that the user can fill out that, when submitted, creates a Prolog assertion that adds that entity’s information to the Prolog database, then redisplays the table so that the new entry is visible. All entities must have a tag, but all other fields in the form are optional. For instance, adding a character named Toblin Stonehill to the world looks like:
                  asserta(character(toblin_stonehill)). asserta(first_name(toblin_stonehill, "Toblin")).
                  asserta(last_name(toblin_stonehill , "Stonehill")).
                  asserta(character_info_list(toblin_stonehill, [first_name,last_name])).
These assertions are generated from the values inputted in the form. Deleting an entity works similarly, with retract statements generated instead of asserta statements to remove something from the world. Finally, editing an entry first retracts that entry from the world, and moves the values of that table row to the form for adding a new character/location/etc. Then when the user edits and submits that form, the new entry is added to the database.

Finally, there are a few additional features to the database frontend. Firstly, I wanted to make sure that the user would be able to quickly reference interconnected elements of the game state, such as quickly seeing what quest is associated with a particular character. To that end, any entry in the table that is a tag of another entry (for instance, the character’s list of quests is a set of quest tags) is hyperlinked to that given entry in the database. For instance, clicking the name of a quest that a character has takes you to the quest page and scrolls down to the entry in the table, highlighting the tag in yellow so it is easy to spot.
I also reimplemented the graph visualization of ways that the players can progress in the story discussed in the first part of this writeup using Prolog queries instead of DataScript queries. This visualization can be seen from the “Visualization” tab at the top of the page.
Summing up
The goal of this project was to create visualizations for Lost Mine of Phandelver in order to show how computational tools might be able to display module information in a more concise way than traditional modules, as well as let users query for the information they want. I present first steps in this direction, describing how I represented information from the game module and displayed this in an interactive table and graph visualization. In the future, I hope to continue working on this project, exploring how I might be able to provide an interface that is quicker and easier for GMs to use on the fly, create better visualizations for what has already happened in the game world such as a log of player actions, and provide creative suggestions for what can happen next in the game world as a creative support tool for new GMs.
You can try out the tool at: https://www.devi-a.com/PhandelverProlog/index.html